Tencent

︎Note:
All designed UI was translated into English for better viewing experience
All designed UI was translated into English for better viewing experience
Solving a new need for a B2B SaaS Platform
Tencent’s client ShouGang, a commercial real estate development group owns a huge development in the outskirt of Beijing. The government named the area an official tourist attraction in anticipation of the 2022 Winter Olympics. The area is comprised of hotels, shops, sports centers and etc.
To better analyze where to place events and to prevent tragedies like stampede, ShouGang came to Tencent hoping to the use our cloud services to track crowd density in the area. So the V1 of this analytics product was born, it allows users to view crowd density of 20 pre-designed area in any given time.
Current Functionalities
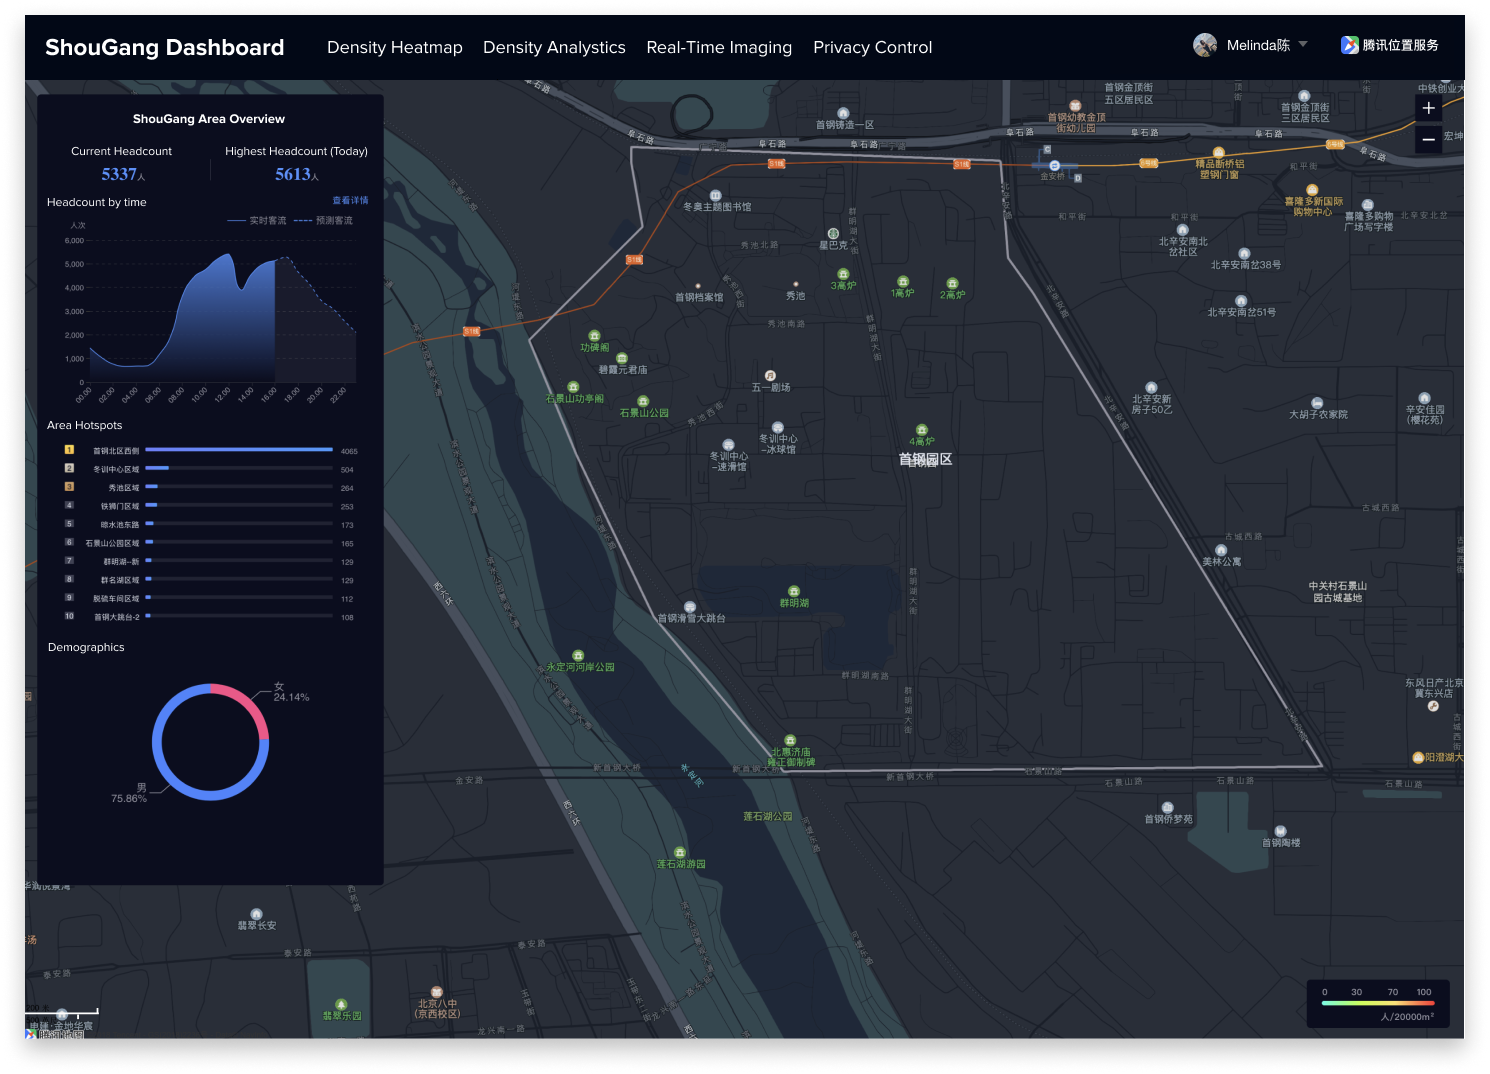
Overview screen: User lands on this page after signing in which provides an overview of the data on the entire development.
![]()
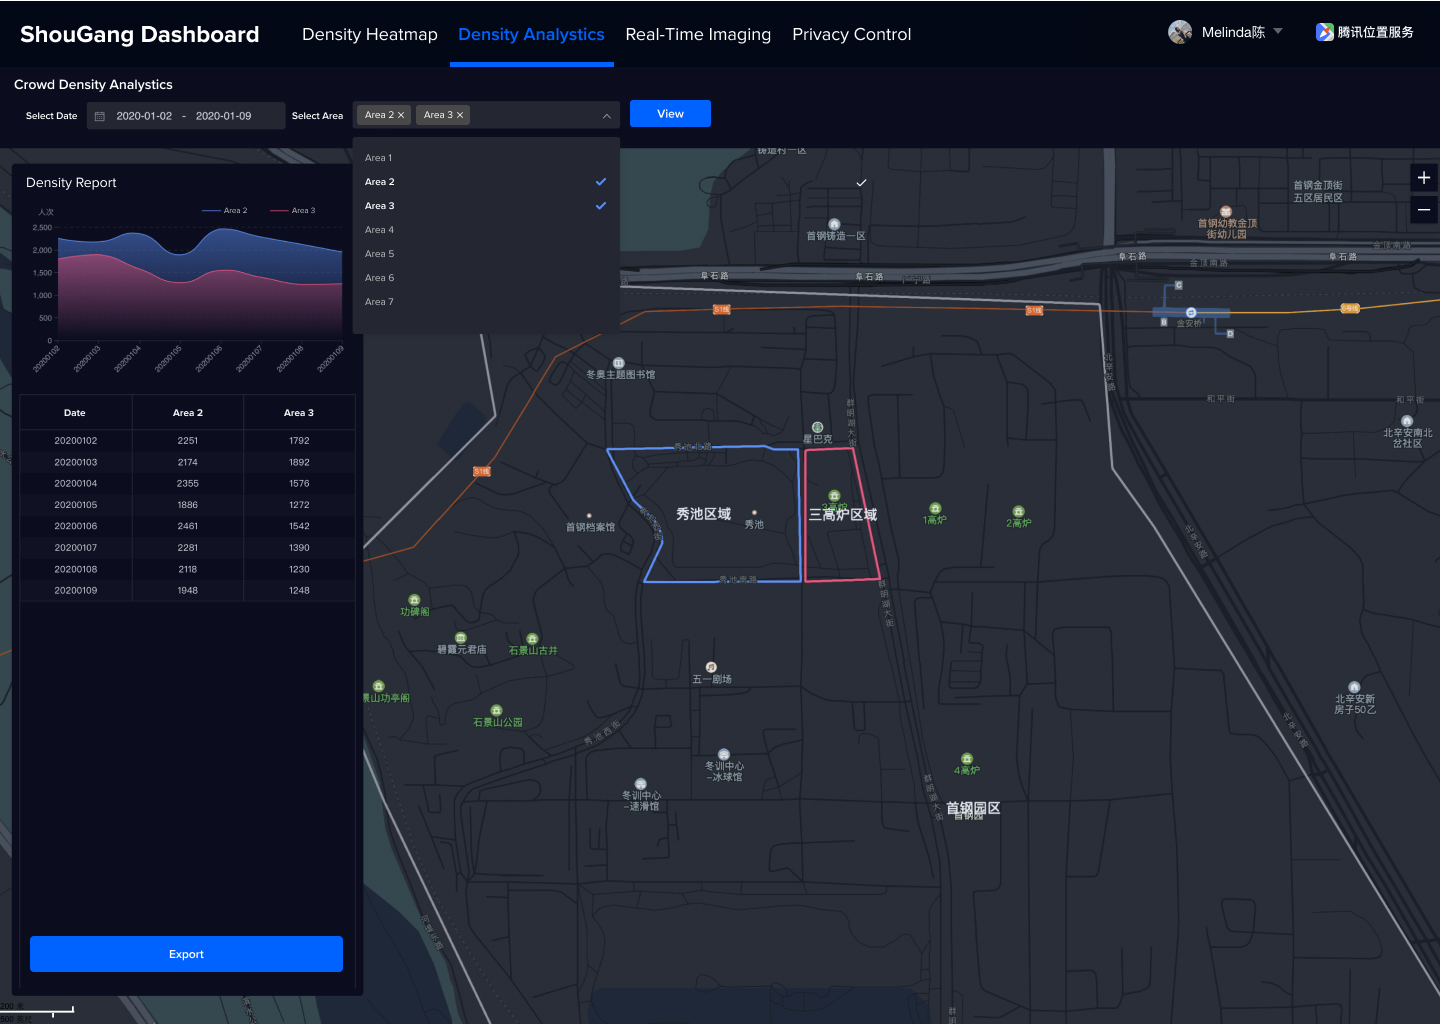
Density Analytics screen: User can view and compare data on the 20 pre-designed areas of any duration and time.
![]()
New Challenges
After half a year of using the product, the client came to us again with 2 concerns.
- New location planning and new development have since been put in place, the pre-designed areas are no longer relevant since the locations have slightly shifted.
- Their commercial clients like hotels and coffee shops sometimes will build on multiple locations scattered in the development area. And they want to see consolidated data on all of their locations at once.
Understanding and Ideating
I was given the responsibility to lead this project. I first read through all the documentation of phase 1 and recorded my questions along the way. And because this was an emerging technology, I scheduled a meeting with the tech team to fully understand the updates on capabilities of new technology.
One of the biggest insight I got from this phase was we had to systemically circle out the 20 areas because of a technical constraint, the technology did not allow for stimuteous area creation. However the technology have since been developed where we could allow that.
One of the biggest insight I got from this phase was we had to systemically circle out the 20 areas because of a technical constraint, the technology did not allow for stimuteous area creation. However the technology have since been developed where we could allow that.
Solution Proposals
After synthesizing all the insights, I proposed two solutions
- Solving for new areas being developed: Giving users the automy to create new areas whenever they want
- Solving for scattered stores: Organize areas together to create area groups, so that user can view data on multiple areas in one view
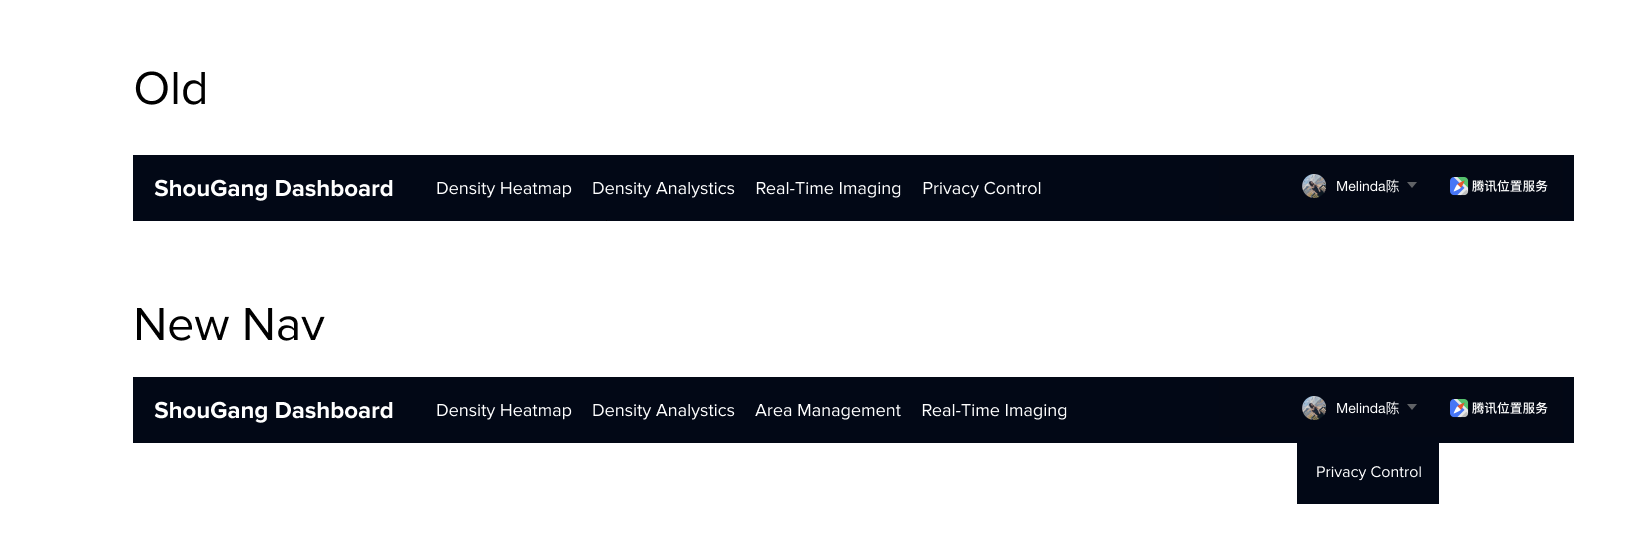
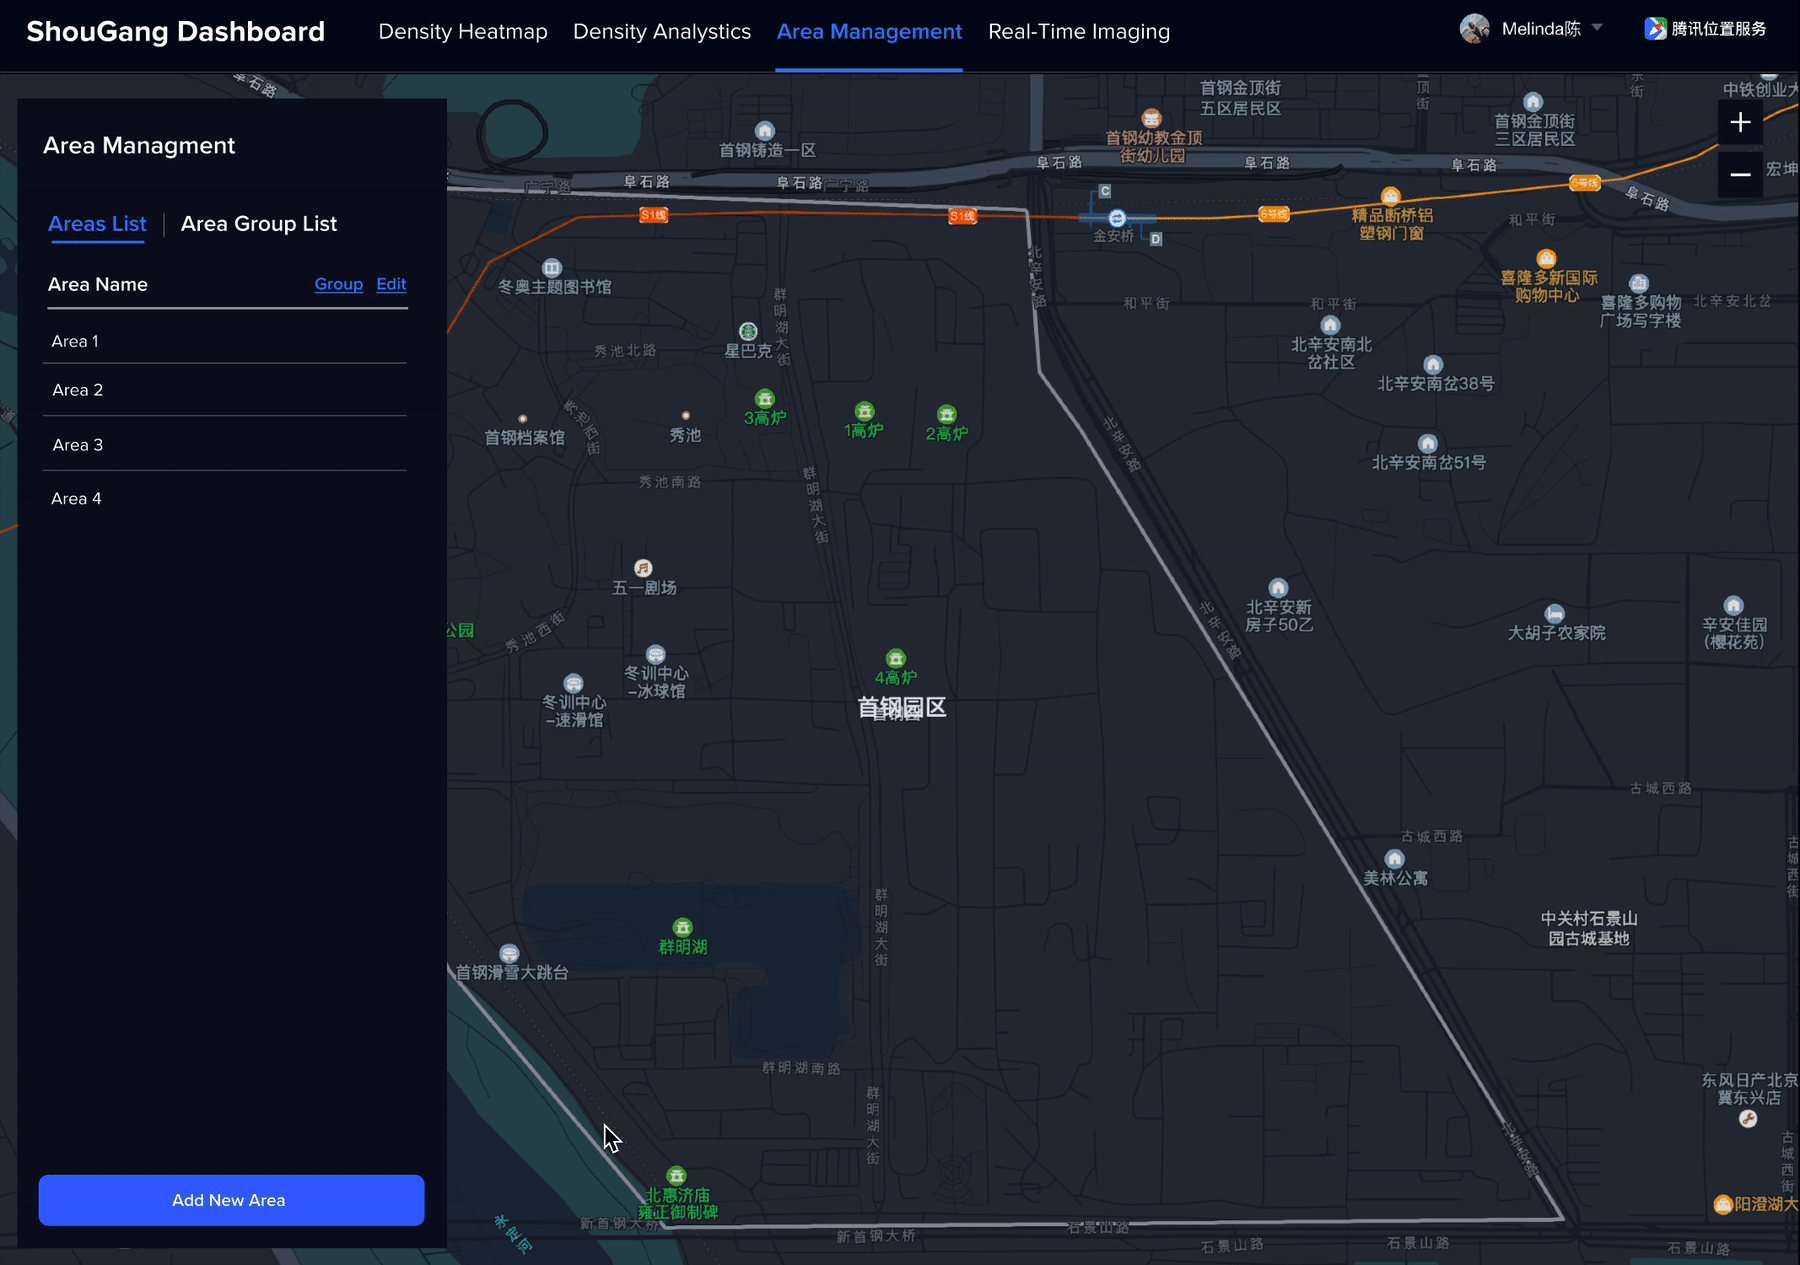
Resulting in adding a tab that is dedicated to area management, so that user can easily add, delete and edit area and area groups.
Design Challenge #1
What is a intuitive way for users to create areas?
Currently all the areas are squares, after studying the map, it was apparent that desired areas will sometimes not be shaped like a square.
So I scheduled another meeting with the tech team to find out if we can give more freedom to user's area creations. The answer was yes and no, they could only identify areas as squares however they are open to workarounds.
Exploration 1
I priortized explorations on creating areas through squares to see if there are workaround where they have more customization.
The pro it is easy to develop.
The con is that user have little control over the drag and select, and in my light testing, I found that people were confused about the map when rotated.
So this exploration was not ideal
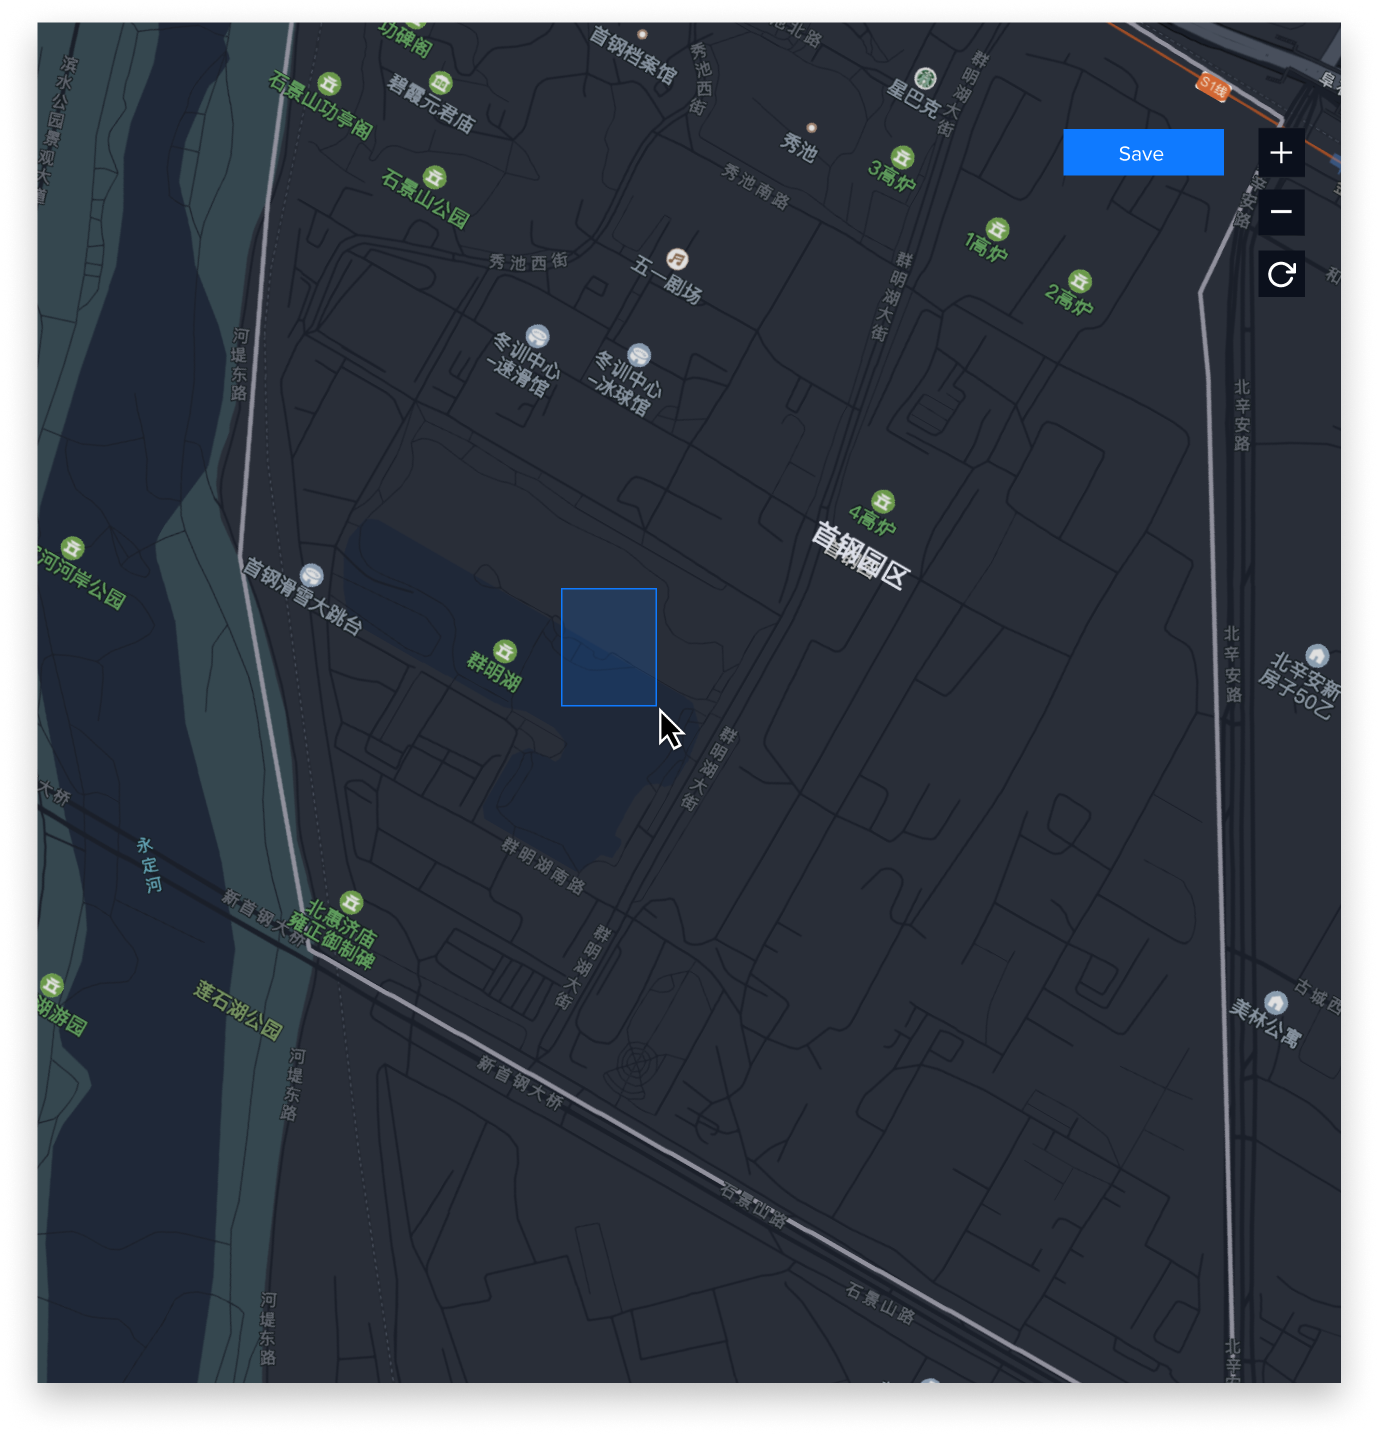
Step 1: User first drag and select an area
![]()
Step 2: User can rotatethe map to select an area
![]()
Step 3: Confirms and create area
![]()
Exploration 2
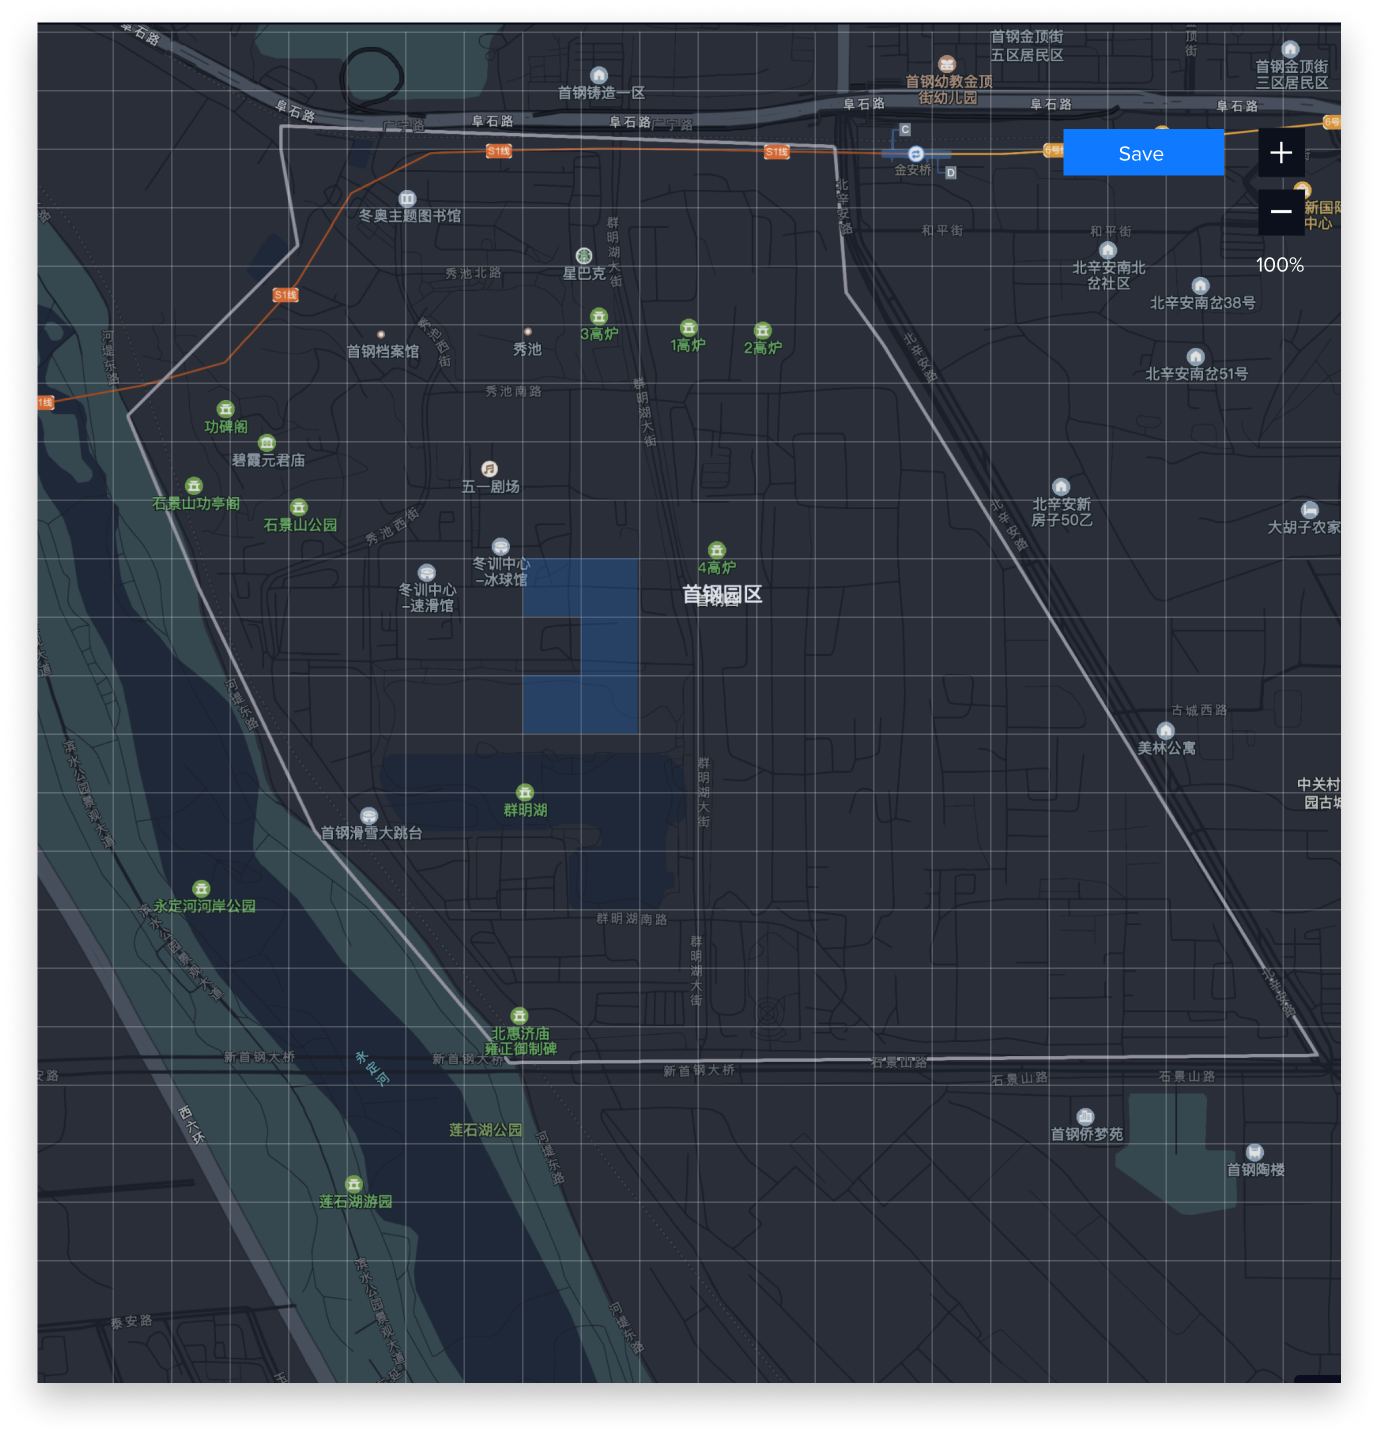
The second exploration I did was to give users an grid to structure their area selection. And they can zoom in and out to go in detail or high level.
This was a better option however still did not solve the problem of selecting an area with a different shape

Exploration 3: The push back
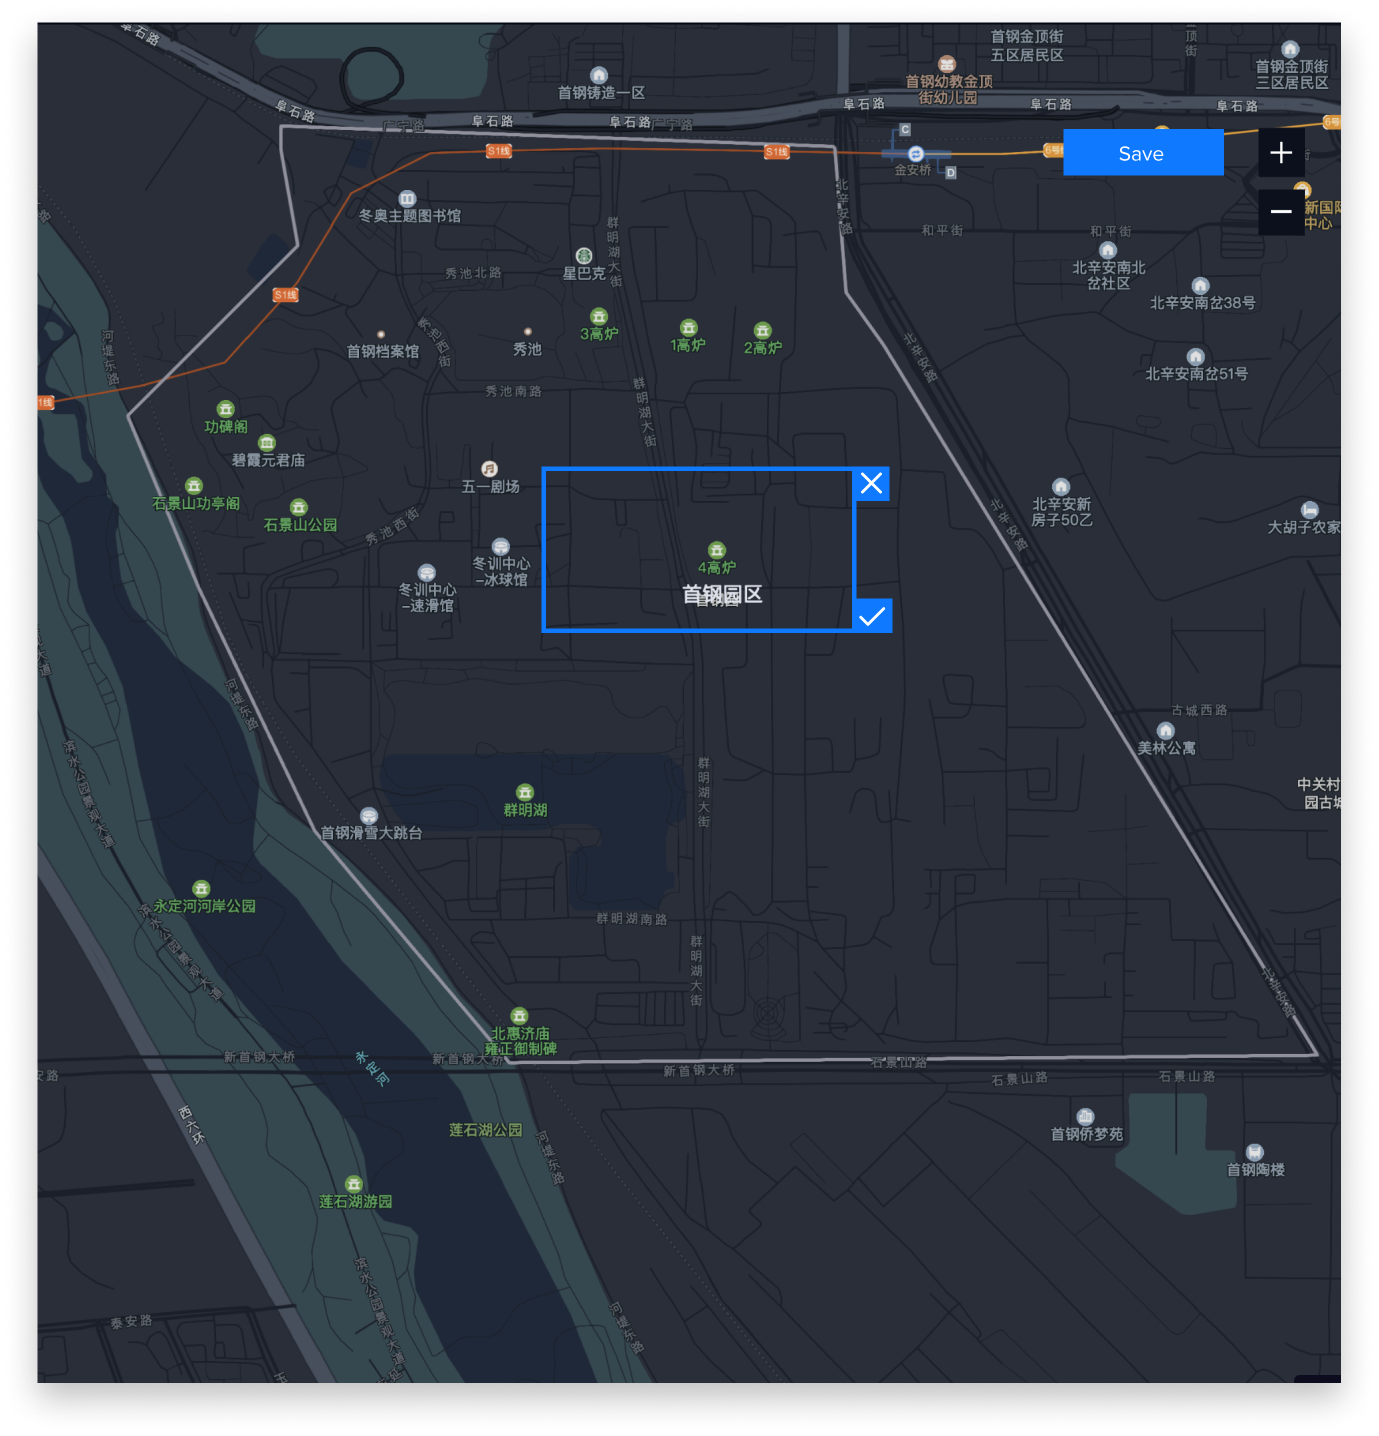
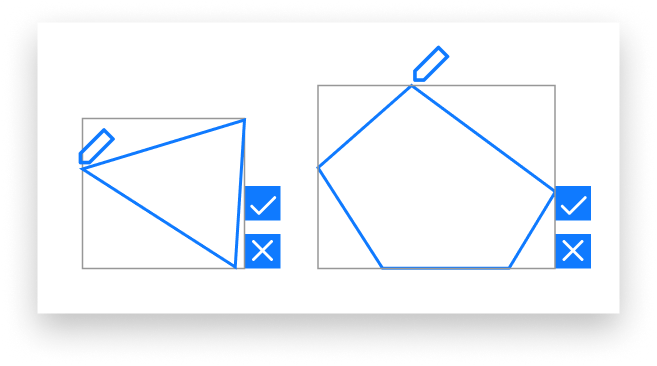
I know as an user experience designer, my job is make user’s experience as intuitive as possible. I know I am not ready to sacrifice the ability for users to customize an area for development reasons.
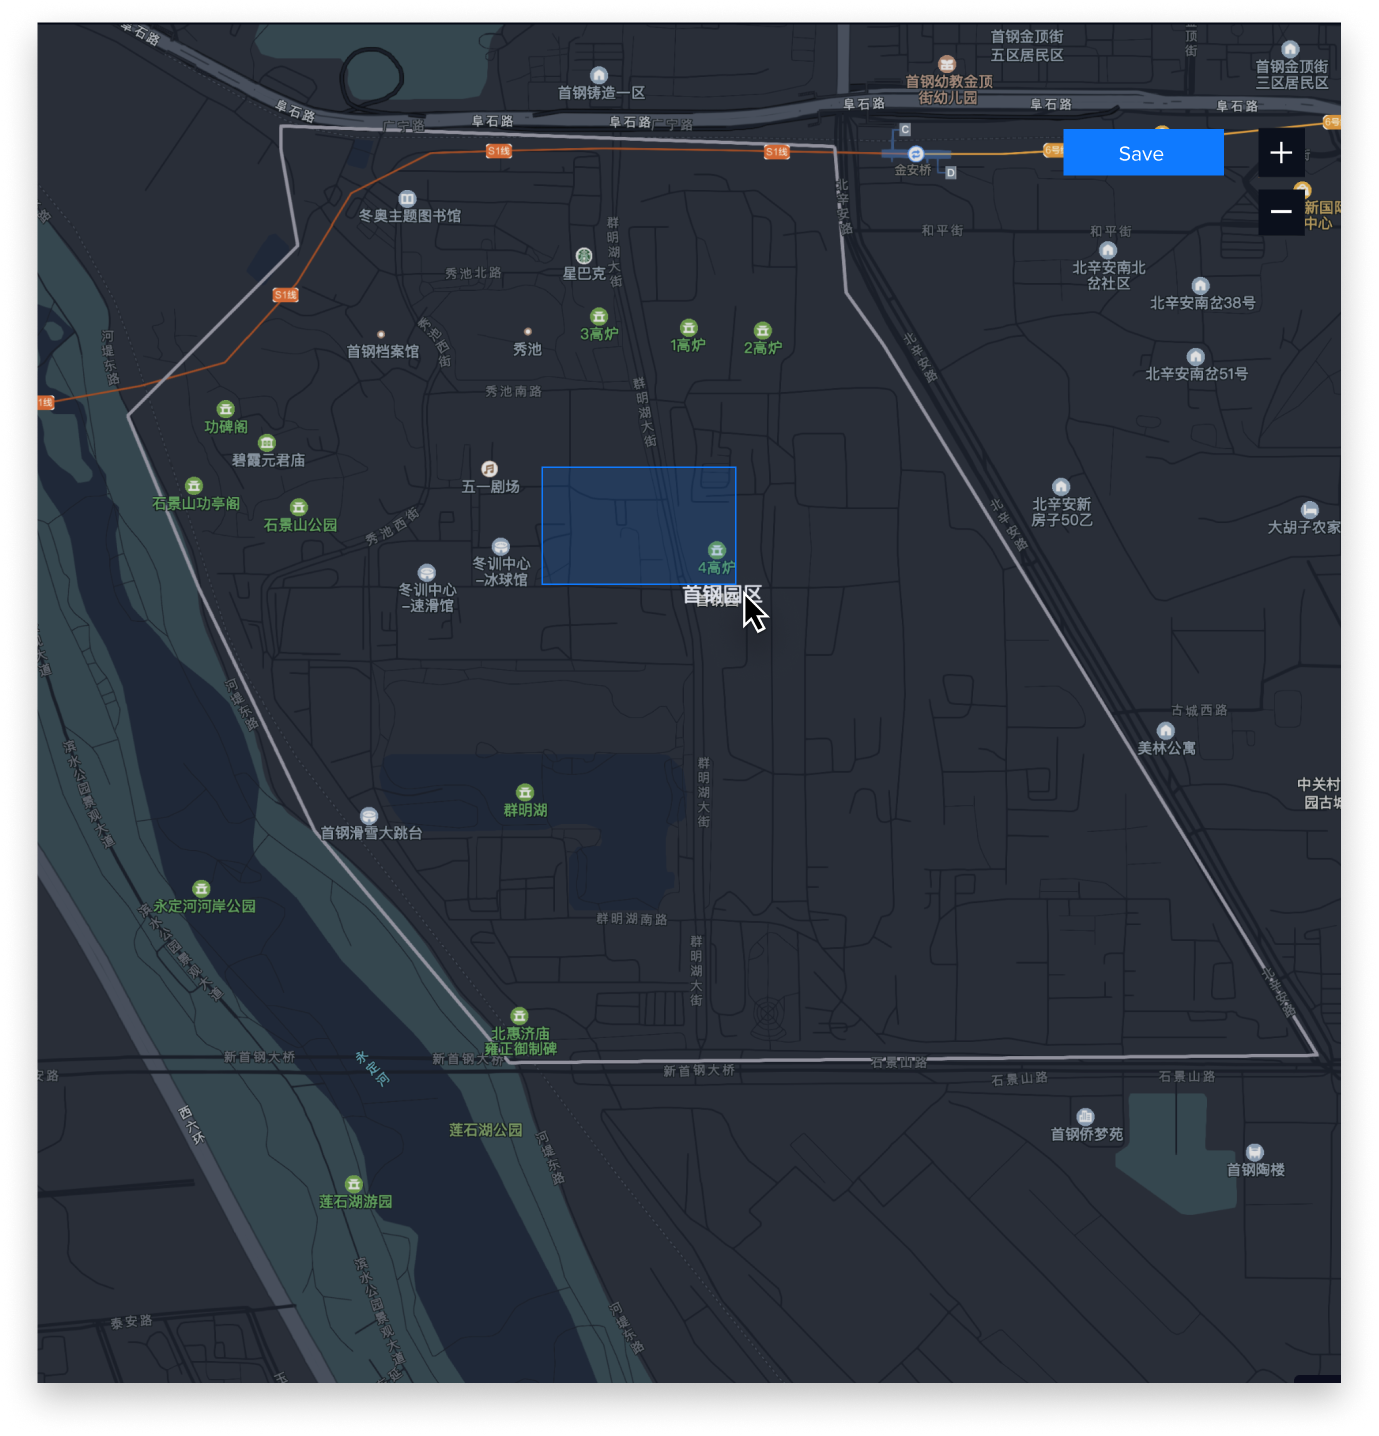
So after exploring the last two options, I started on a third one that allows user to draw polygons. To do a tech workaround, I recommended they create an invisible square around the points so they can identify the area. And then we could a calculation to get the actual selected area.
And it was approved!
Design Challenge #2 - Overlapping Areas
Now that we have given user the ability to create areas however they want, we have also created a scenario where it could create complications. Overlapping areas will result in duplicated data.
If areas are overlapped, the data on the overlaps will be counted twice. The first part of preventing this from happening was to signal to users.
There is two touchpoints in a user's journey that this could cause this to be a problem.

First is when the users are drawing the areas
The first explorations I did was to function where we could identify the overlapping areas and ask if the user wants to keep it or delete it.
Even though this function is helpful but it is not a priority because of two things:
- The overlaps might not affect how data is viewed, it could only be a problem if two areas with overlaps are viewed at the same time. In the example of two stores next to each other, their proximity might overlap but their data will be used by two different commercial clients.
- It is estimated to push our timeline back for 3 weeks, so after a discussion with our PM, we have decided to pass on this option for phase 2 but prepare for it for phase 3.
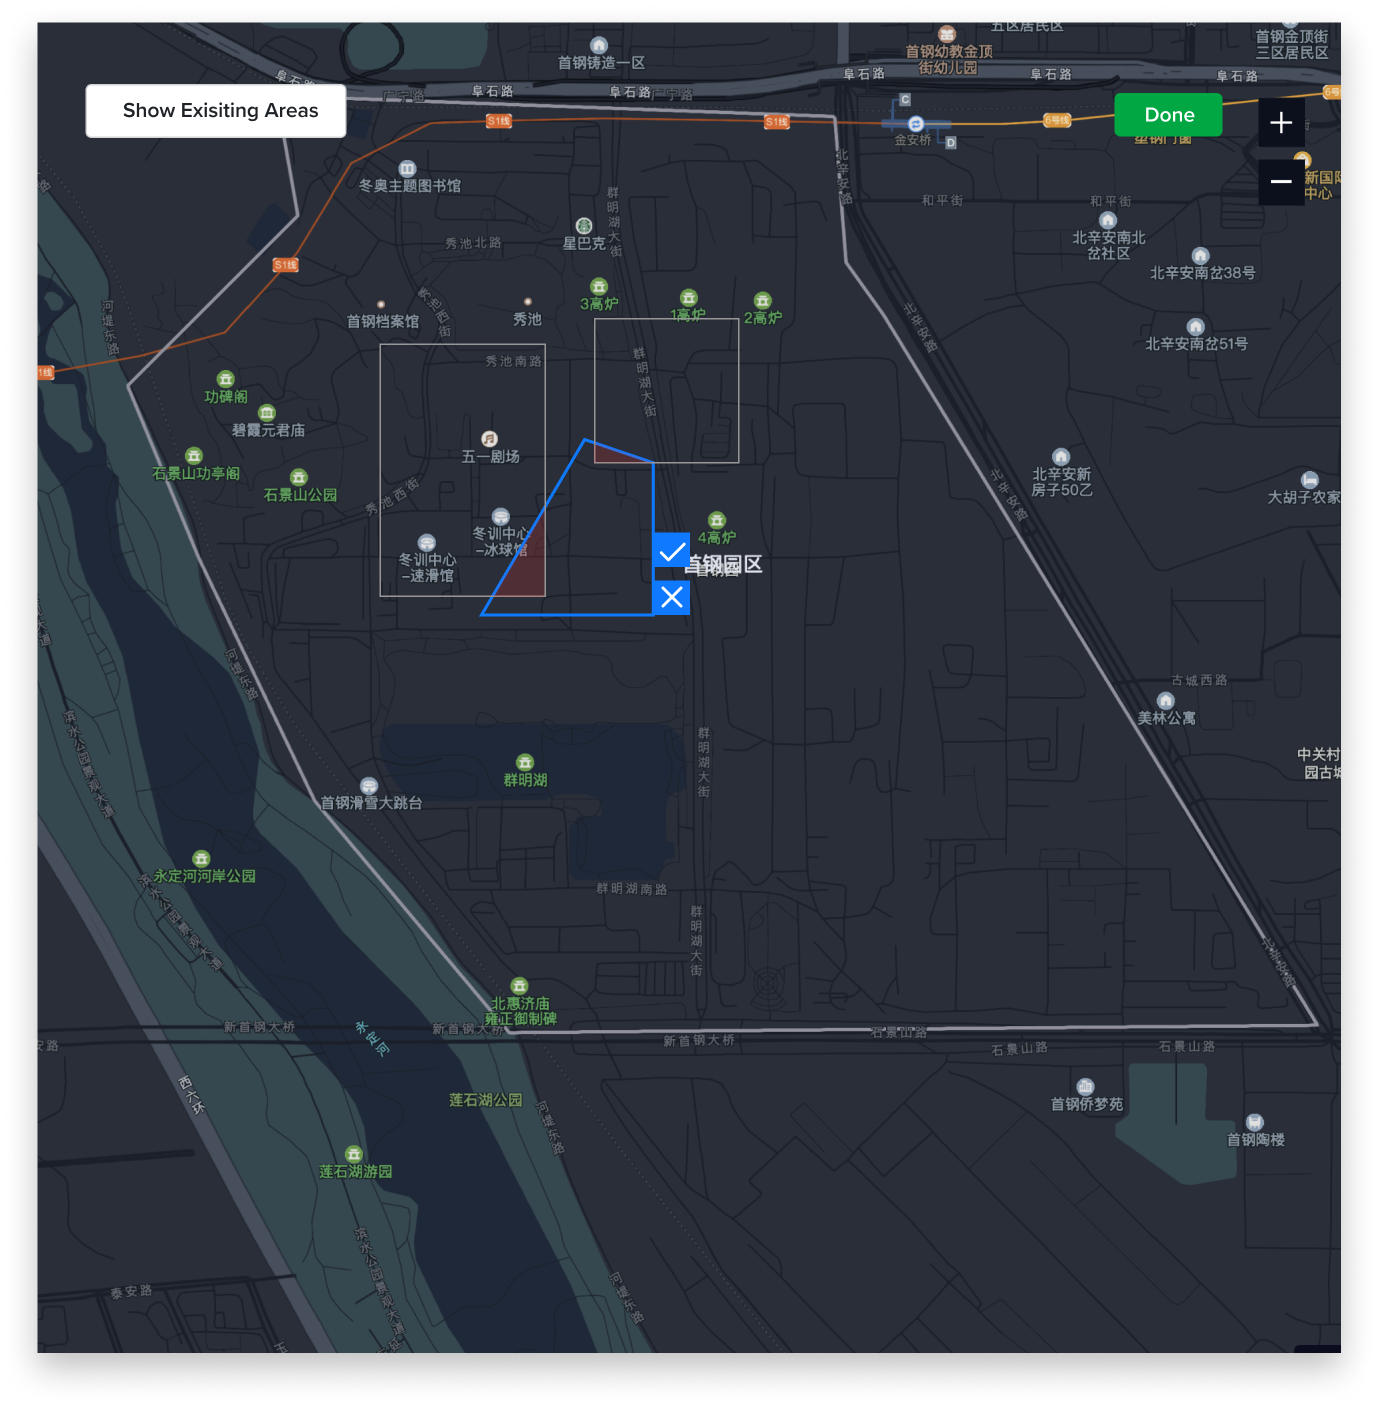
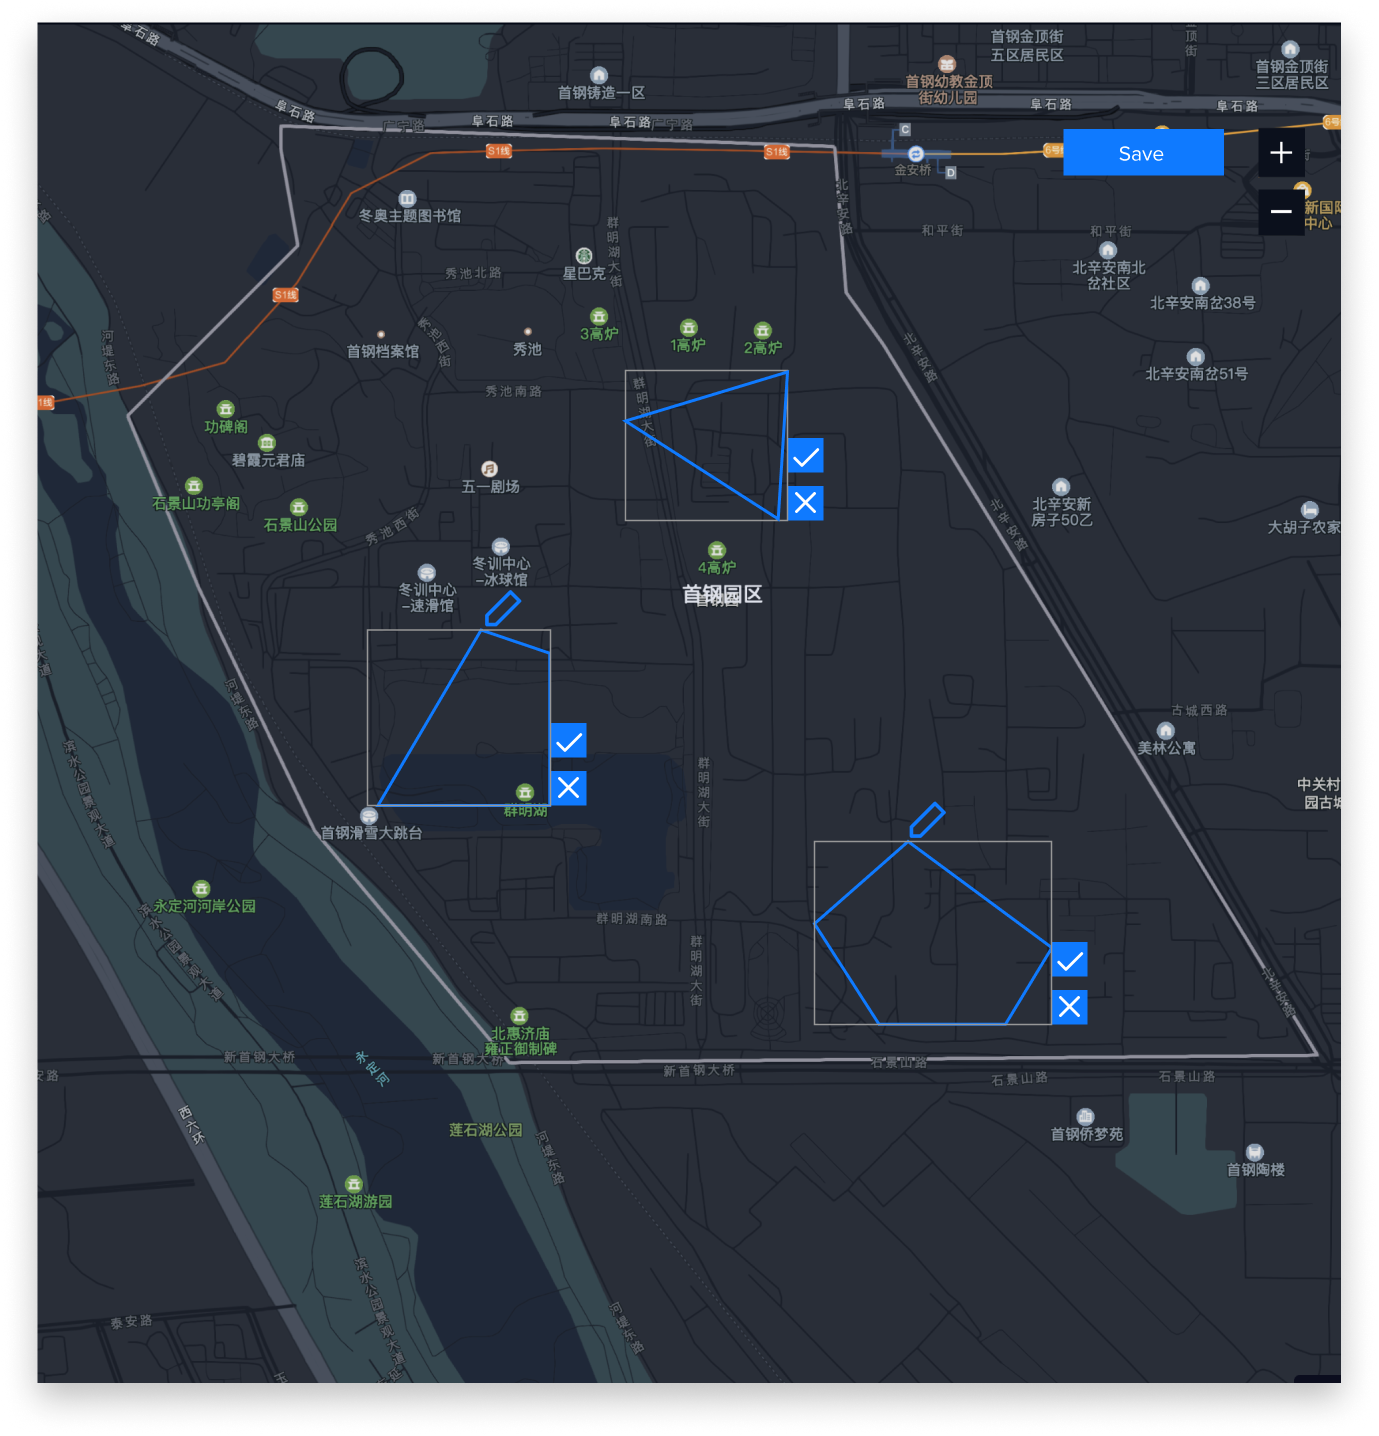
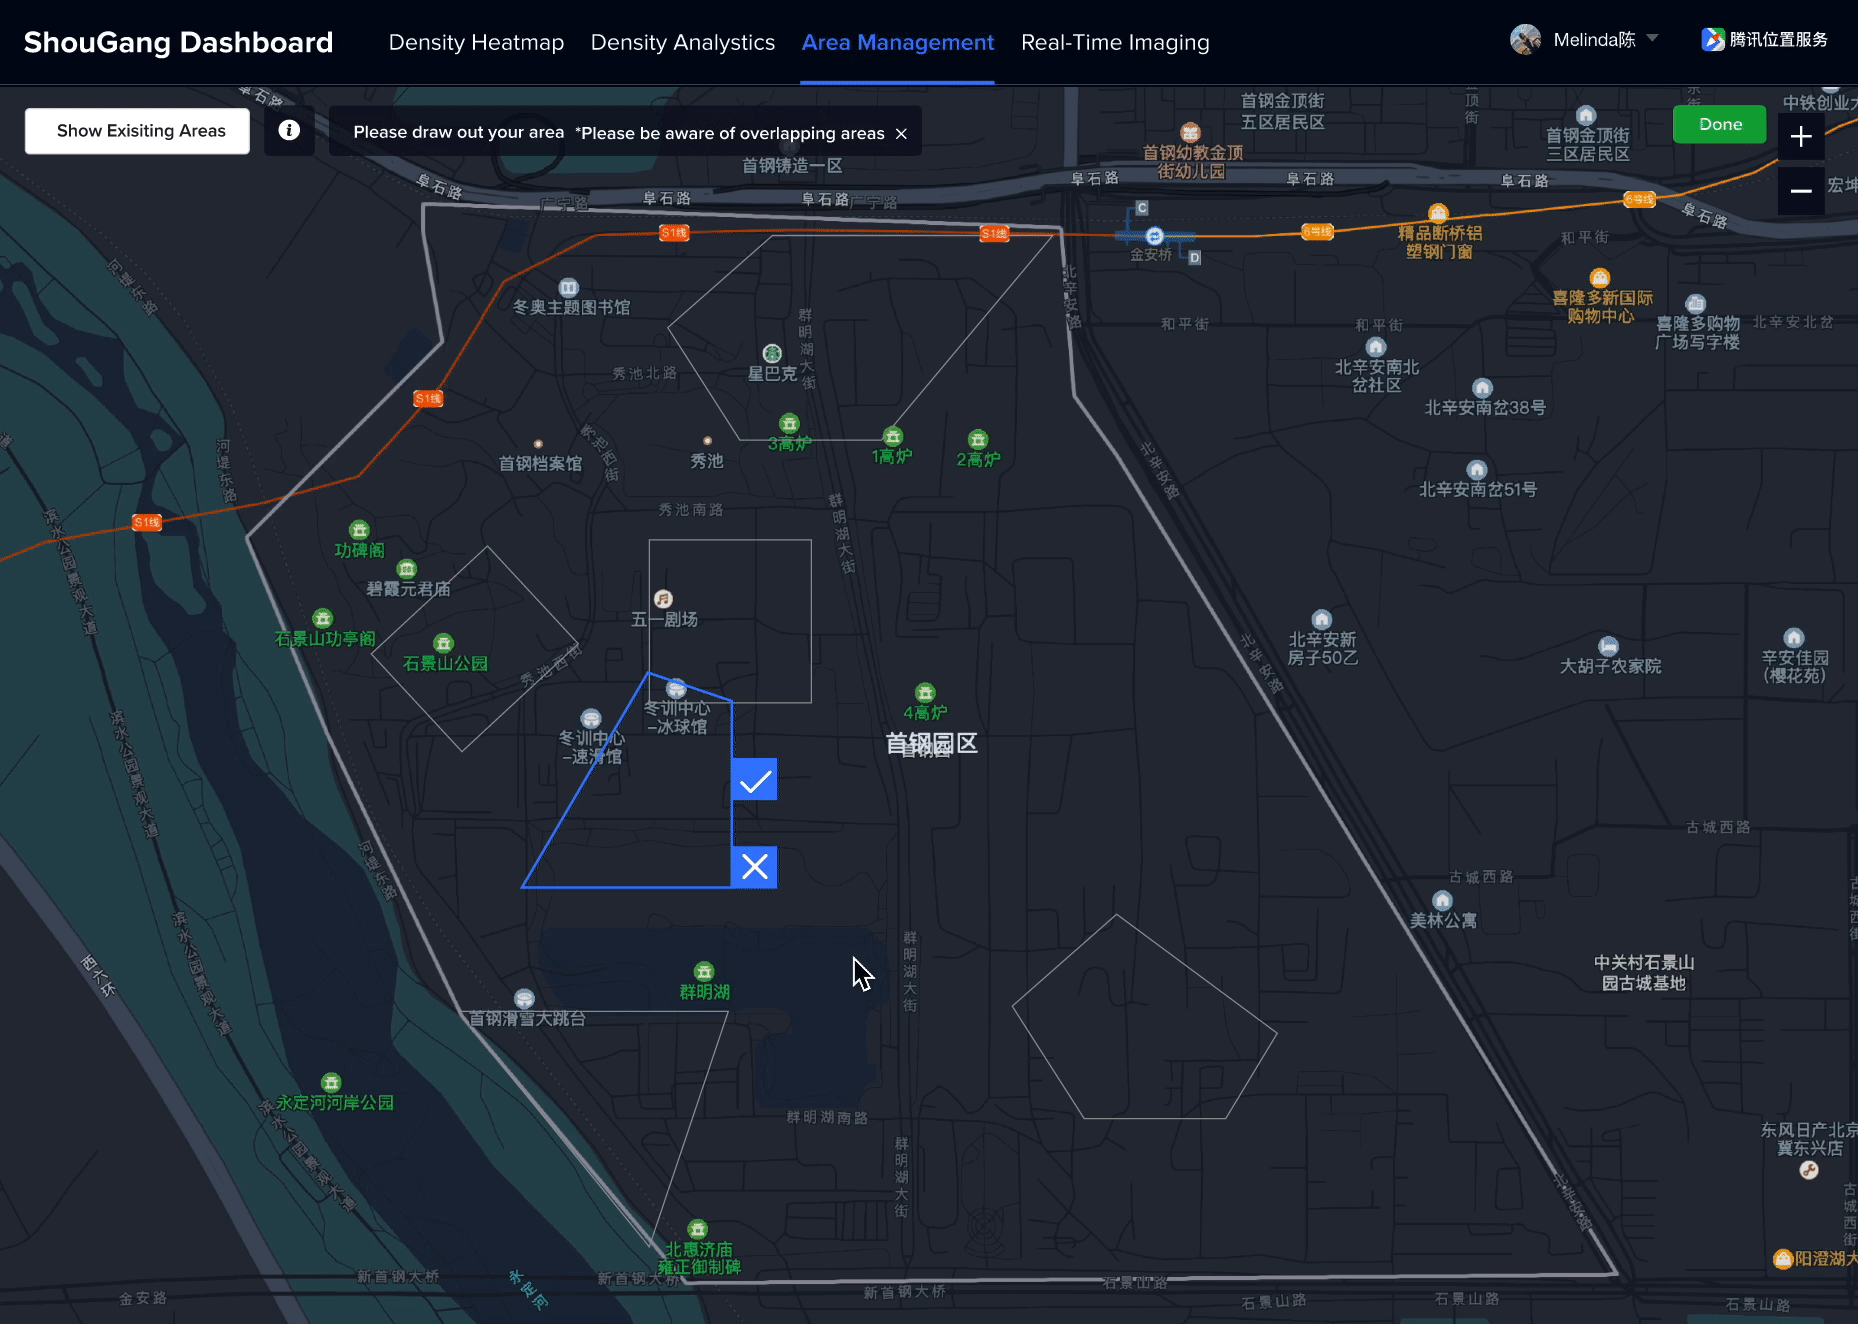
Final flow of creating an area
Part One
Giving users the option to see existing areas, so they are more consciously drawing new areas
Giving users the option to see existing areas, so they are more consciously drawing new areas
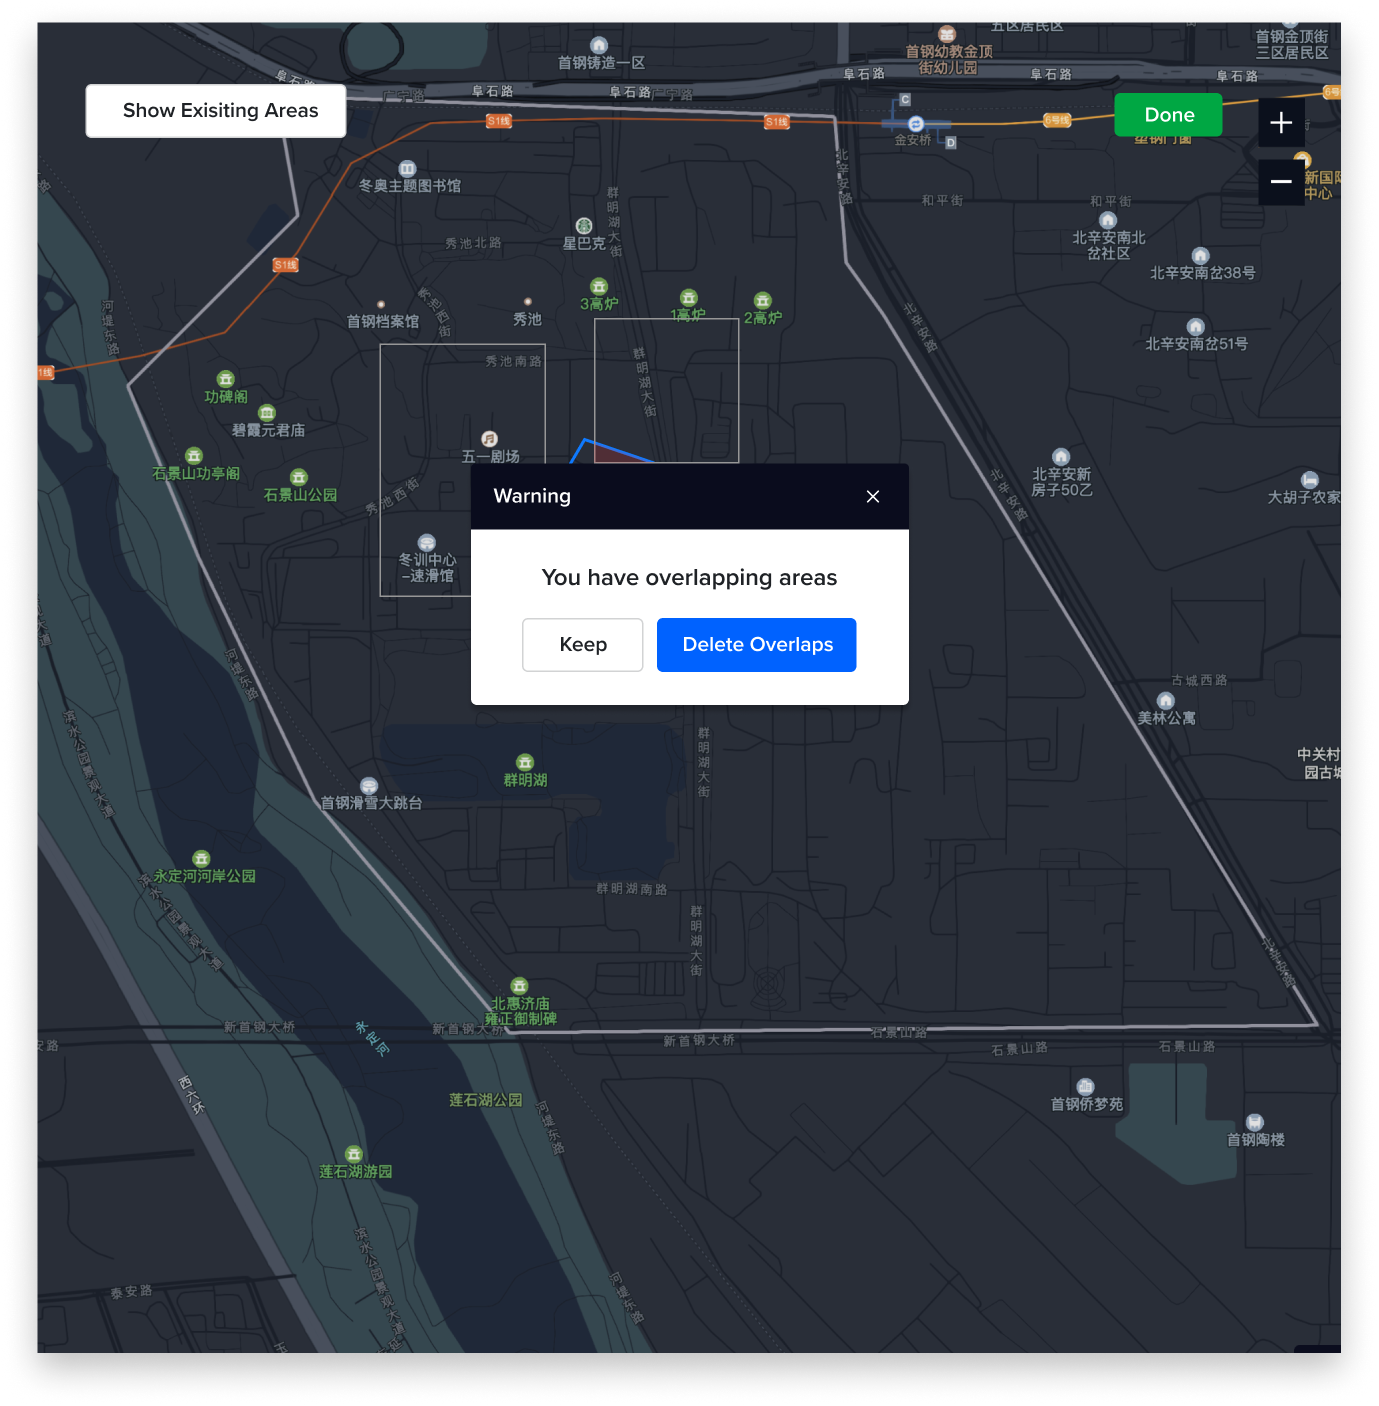
Part Two
Gently warn and confirm with users that they have overlapping places with other areas before naming the new area.
New area created will have a new tag next to it for 30 seconds before disappearing
Gently warn and confirm with users that they have overlapping places with other areas before naming the new area.
New area created will have a new tag next to it for 30 seconds before disappearing
The Second touchpoint
Happens when user is viewing/exporting the data which I will talk about with the next challenge, grouping areas.
Design Challenge #3 - Area Groups
To solve for scattered stores - Organize areas together to create area groups, so that user can view data on multiple areas in one view.
My first proposal was to give user the ability to draw multiple areas however tech pushed back and said they currently cannot support that function.
So I designed a function where user can select areas from the area list and make them into an area group
My first proposal was to give user the ability to draw multiple areas however tech pushed back and said they currently cannot support that function.
So I designed a function where user can select areas from the area list and make them into an area group
Grouping
To group areas, the user clicks on “group” and select the areas they want to put in an existing group or to create a new one.
To group areas, the user clicks on “group” and select the areas they want to put in an existing group or to create a new one.
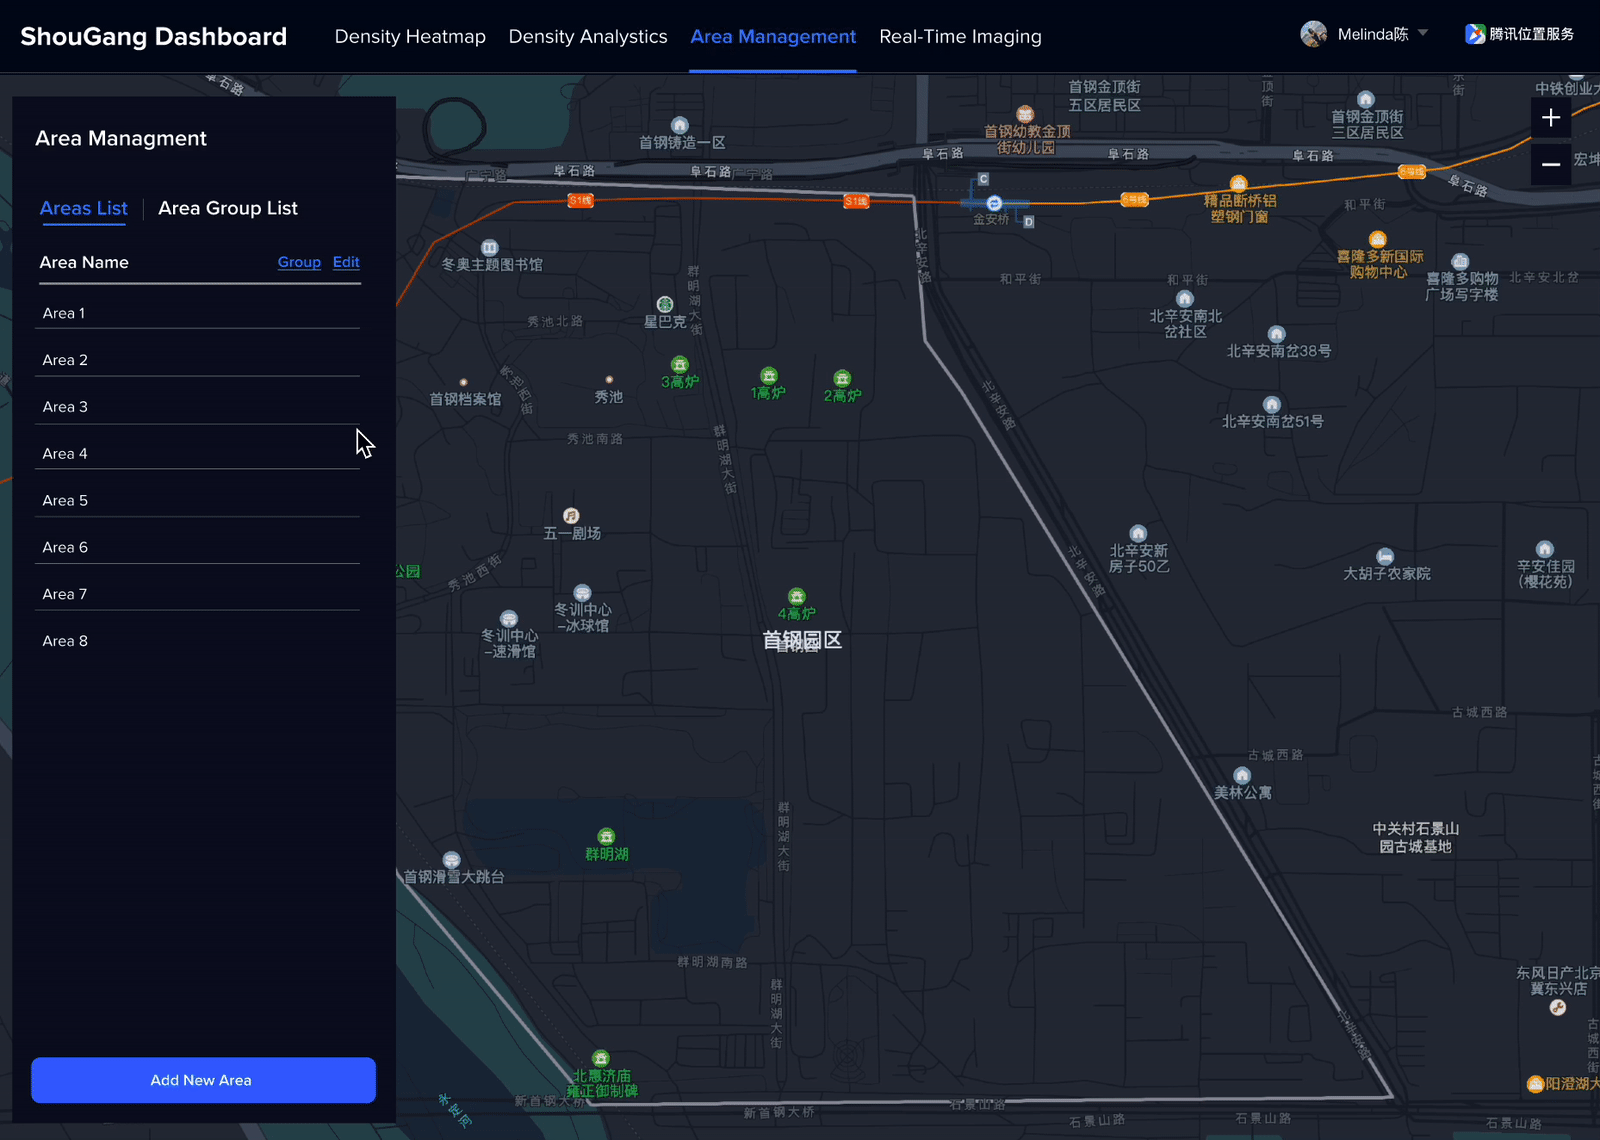
Ungrouping
To remove an area from a group, the user simply has to click on edit and and unselect the area from the group.
They can also change the name or delete under when editing.
To remove an area from a group, the user simply has to click on edit and and unselect the area from the group.
They can also change the name or delete under when editing.

Viewing and Exporting Data
Currently, the user could only see the data on the pre-designed areas as I have showed earlier.

New areas and area groups added another layer of complications
This is the second touchpoint where overlapping in two areas could cause a problem.
There are two user needs in play when viewing and exporting data:
- Comparsion - When user compares two areas, overlaps might not concern the user because area A and B both have the data
-
Areas as a bundle - However, if the user wants to see the data A and B together, that is when the data will be incorrect if the overlap is counted twice
So I designed a function where user could choose between the two choices.
Viewing Data
User can now select from areas or area groups to compare and view dataTo make it more convenient for users to see their selection, I also implemented their corresponding color when selecting areas.
![]()
User can now select from areas or area groups to compare and view dataTo make it more convenient for users to see their selection, I also implemented their corresponding color when selecting areas.
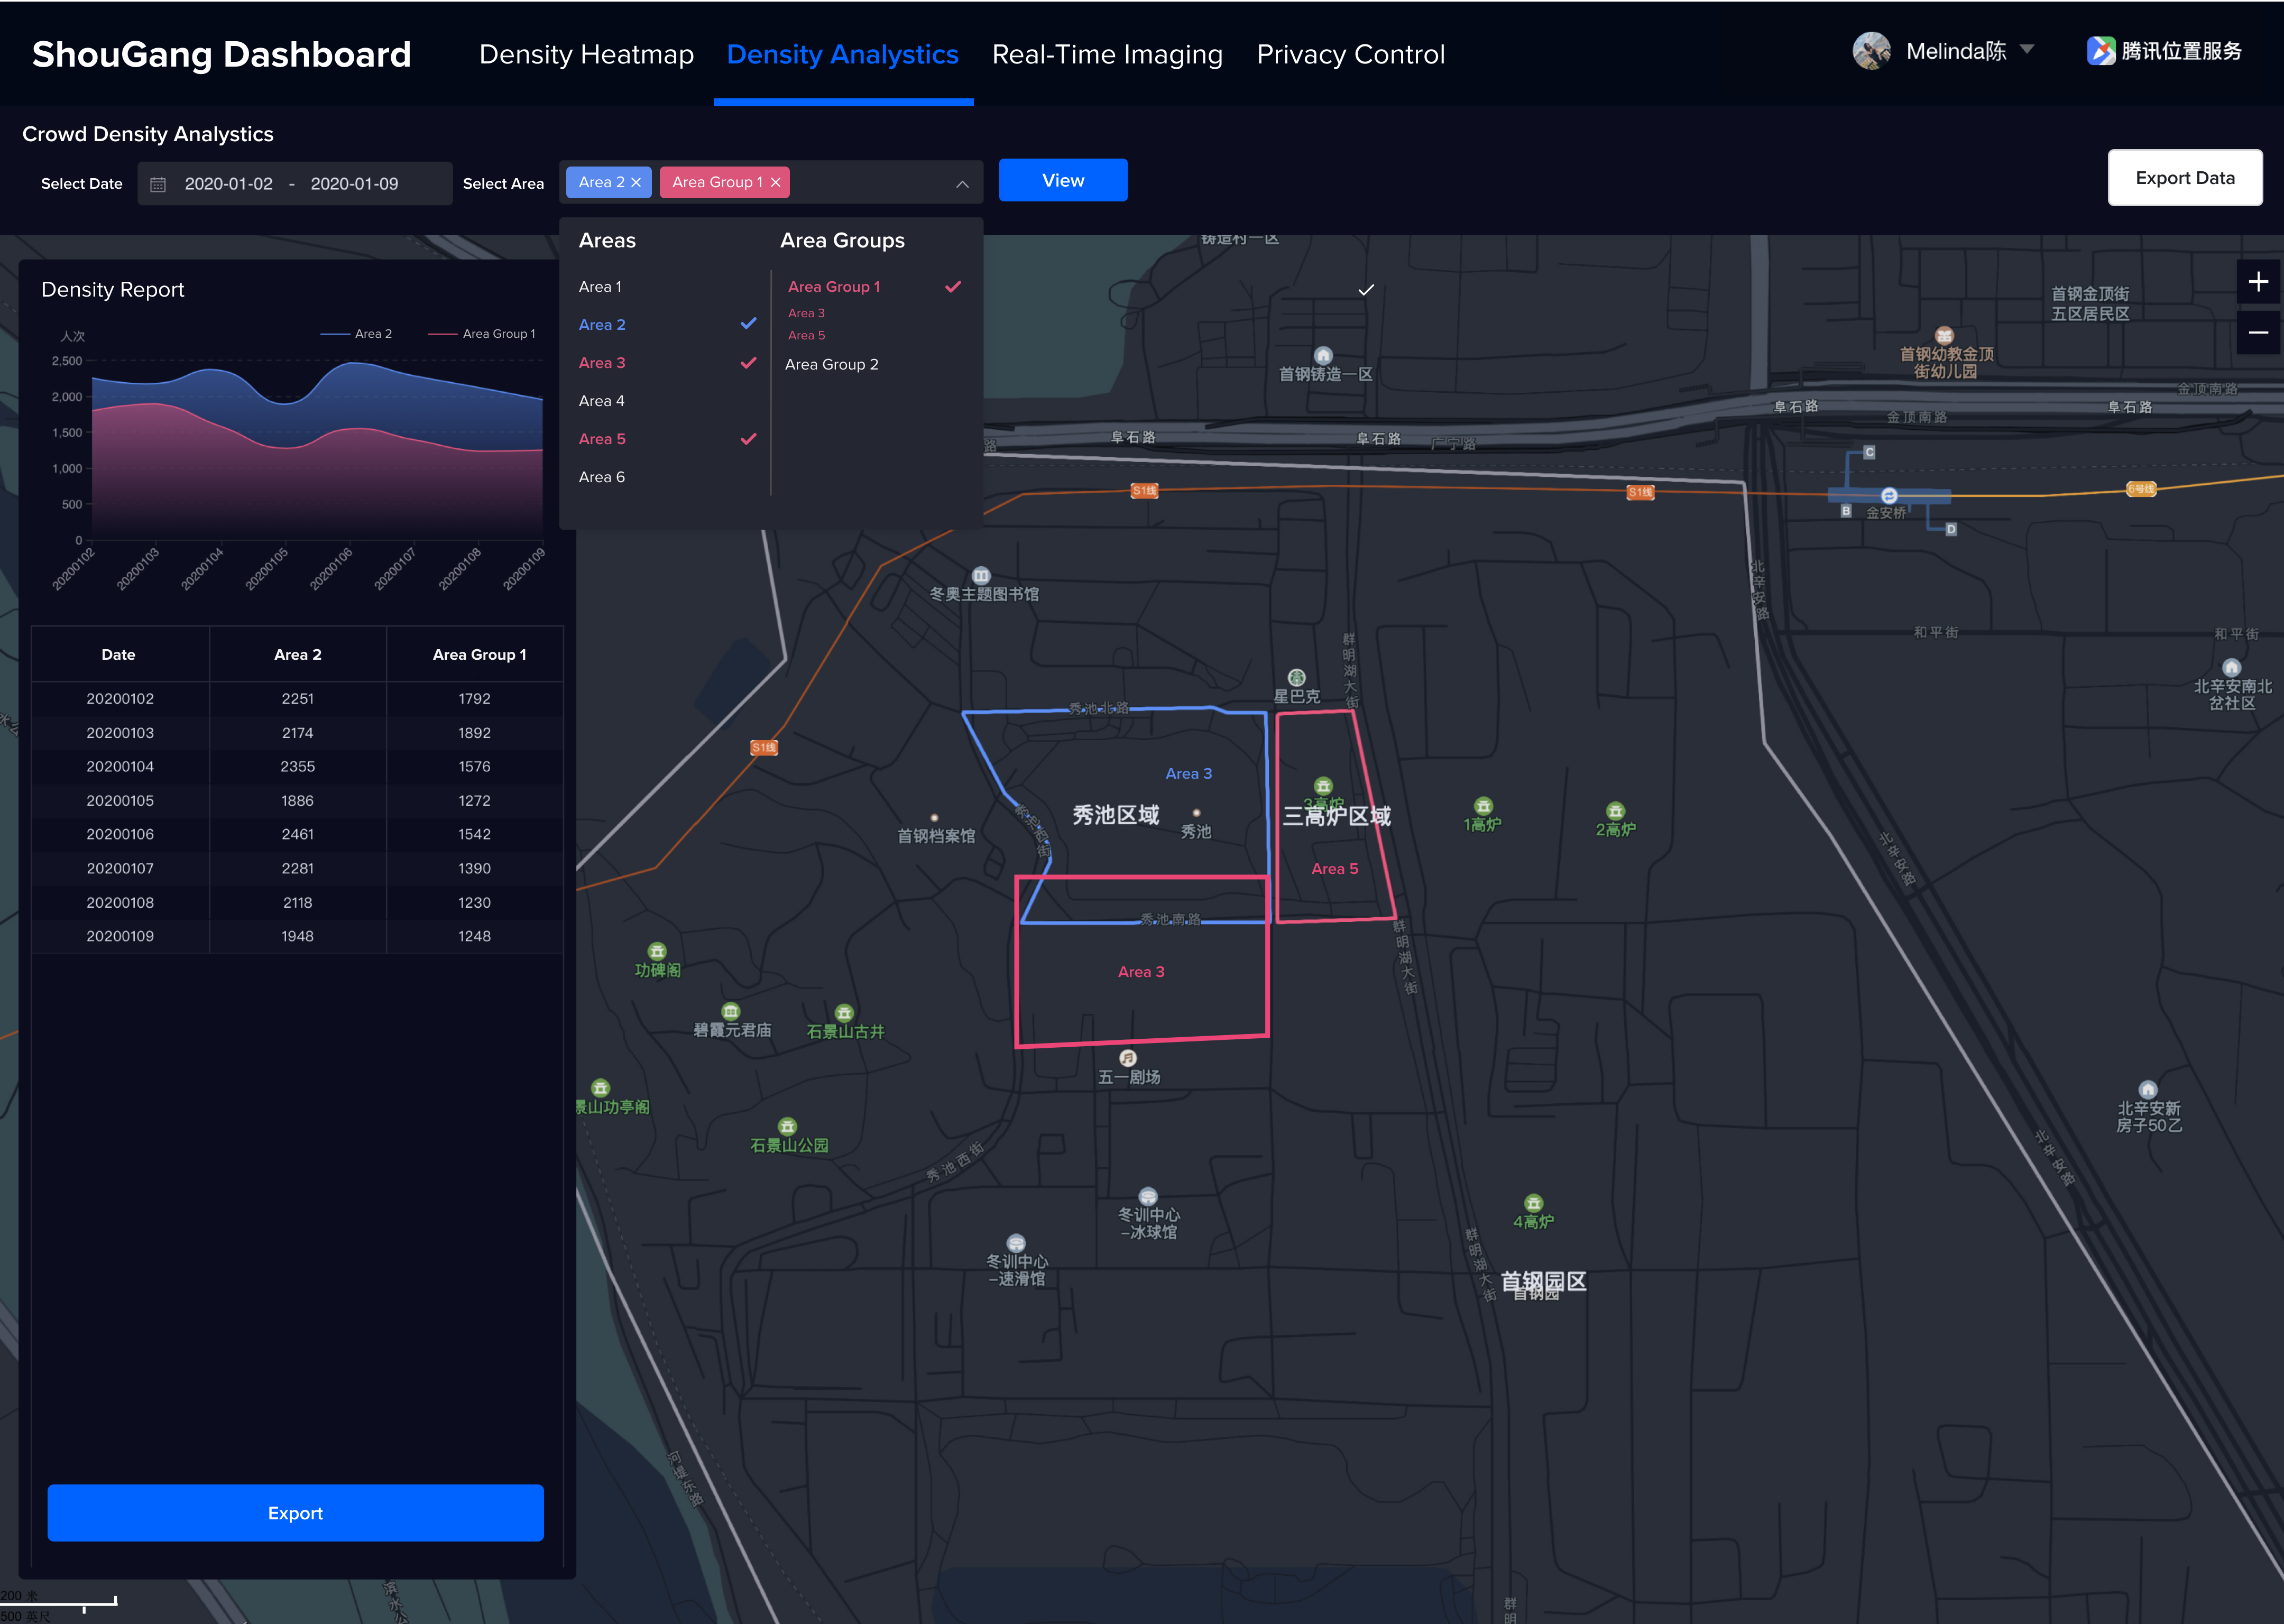
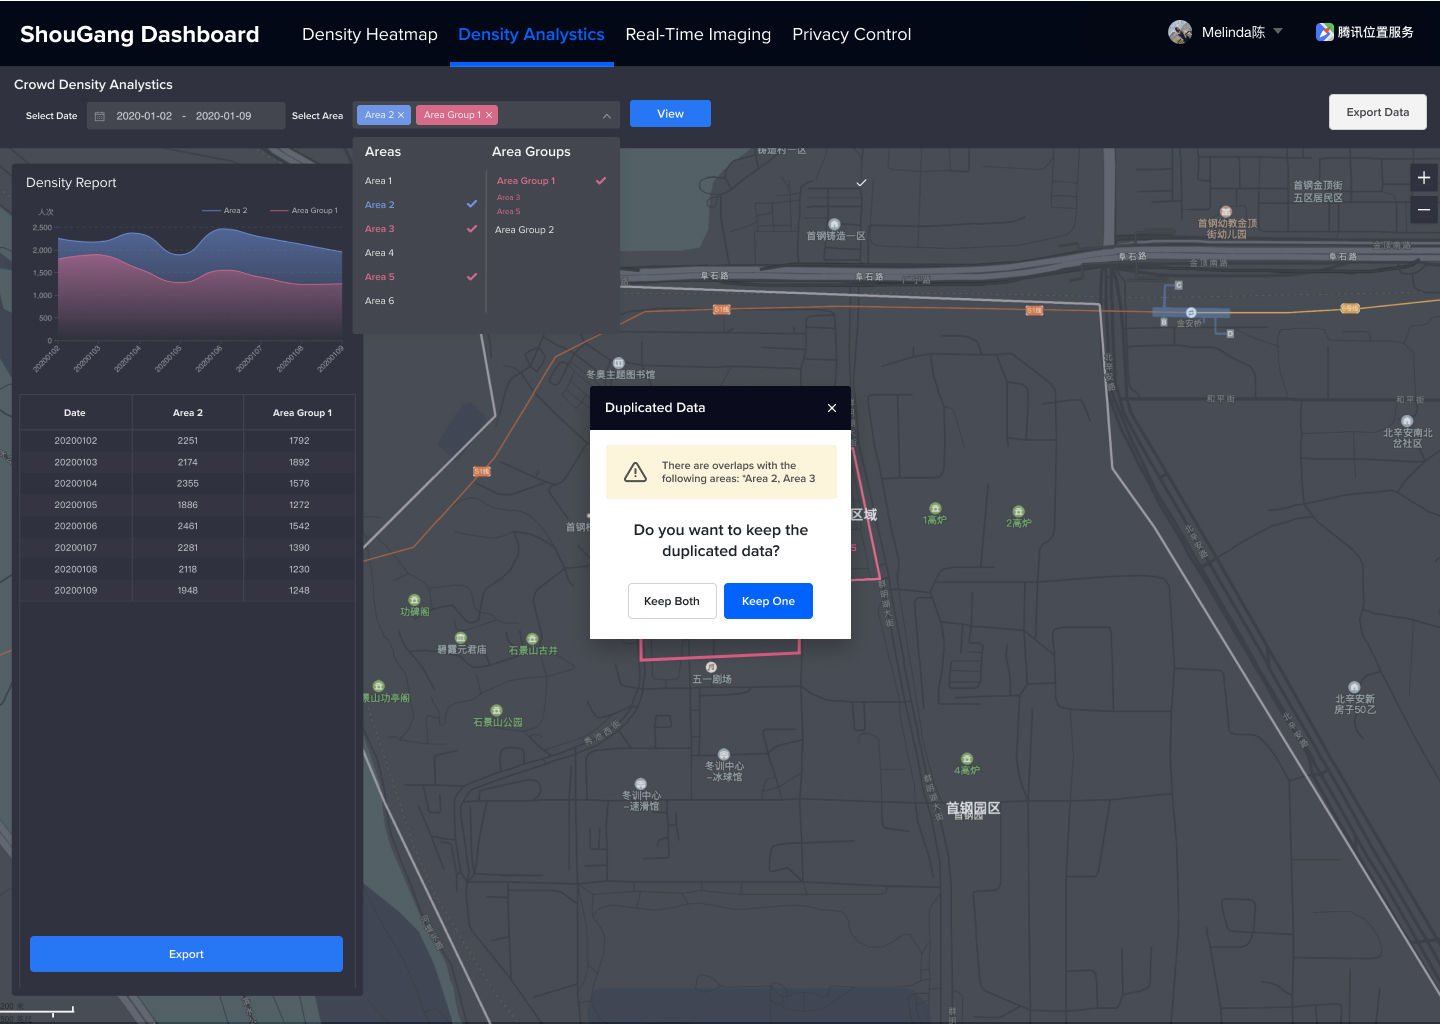
Overlaps
If we identified an overlap selections, we will automatically ask if the user wants to keep the duplicated data or keep in exporting.
![]()
If we identified an overlap selections, we will automatically ask if the user wants to keep the duplicated data or keep in exporting.
Phrase 3 Planning
Before leaving the project, I documented clearly our process and our decisions and also wrote suggestions for phase 3.
The phase 3 prioritization suggestions include:
- Developing a smart editing function for overlapping areas, asking users if they would like to delete the overlapping areas
- Adding more diversity and customization to drawing out new areas like circles.
- Supporting the editing of area, if the user wants to add space into one area, this will be extremely helpful.
© Melinda Chen